DRIVE
A rapid human-computer
interaction prototyping tool
The Situation
Iterative practices are standard for visualization and user interface design, demonstrating impressive benefits in both usability and effectiveness. Iterative design is particularly applicable to user-centered design approaches (like Cognitive Systems Engineering), where analyses of human-machine system performance depends on assessing the impact of new or modified technical artifacts upon existing workflows. These analyses typically depend upon consultations with subject matter experts (SMEs) in complex work domains. Iterative design efforts must maintain a balance between creating more ambitious designs and maintaining evaluation and design-refinement activities. Minimizing the effort required to present concepts and prototypes means more effort can be devoted to visualization design and refinement.
The Charles River Analytics Solution
To help display designers present mature capabilities more quickly, Charles River’s scientists and engineers created DRIVE™. DRIVE supports the steps of the iterative design process, which typically include:
- Analysis – Initial requirements are assessed, or feedback from the previous evaluation is collated and distilled into additional requirements
- Design – Requirements are translated into mockups or detailed descriptions of visualizations
- Development – Design concepts are translated into reality through engineering
- Evaluation – Physical artifacts are evaluated using a variety of techniques, including heuristic analyses and cognitive walkthroughs
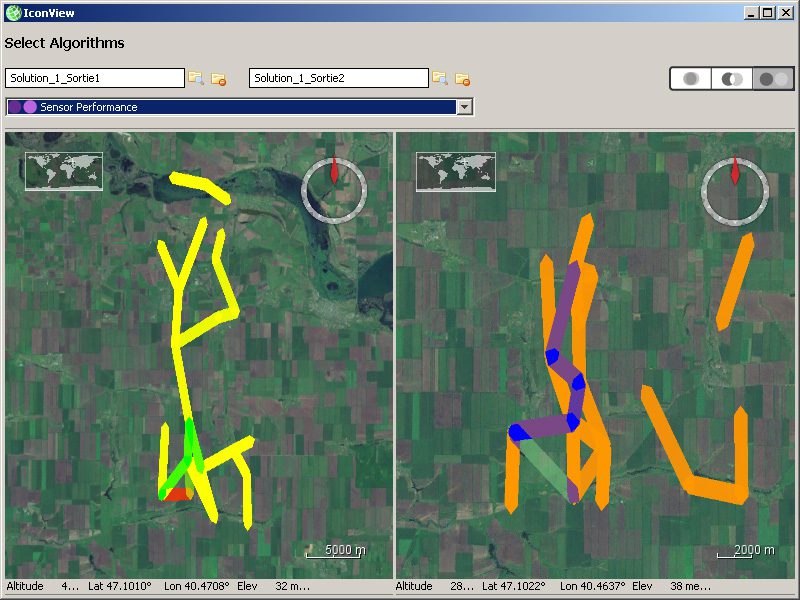
In this figure, DRIVE is representing meta-information on two unmanned aerial vehicle (UAV) flight paths.
Many tools support the steps in the iterative design process; however, they do not support the rapid execution of all the steps. We structured DRIVE based on the relationships between underlying information and the visual techniques used to represent that information, which makes specifying those relationships lightweight and easy to replace. While the visual elements that compose these relationships are drawn from a collection of techniques, they are not components—instead, they are represented as a series of transformations upon a base object, such as an icon, a geospatial region, a line on a graph, or a network node or link. An ontological structure is also provided as a foundation for the necessary information architecture. This ontology defines the relevant information in the domain that may be represented, and each element of the ontology can be mapped to different visual techniques.
DRIVE’s components include Metronome™, a rich-client application framework that enables developers to create powerful, easy-to-use interfaces by freeing them from concerns about low-level functionality common to all applications.
The Benefit
DRIVE enables rapid prototyping and development. DRIVE’s core architecture allows rapidly configurable “mappings” between the components of data models, the users’ specific information needs, and visual elements and techniques for representing information and meta-information. Creating these mappings enables the display designer and developer to quickly generate and refine designs. DRIVE supports the development of high-fidelity information visualizations and impressive visual effects while maintaining flexibility and supporting iterative design.
DRIVE can be used by display designers and developers to quickly generate complex visualizations of both information and associated meta-information, such as uncertainty, pedigree, value, or relevance. DRIVE can generate new visualization designs, implement those designs using different graphics packages, integrate them within an application framework, and evaluate them in user tests-all faster than with standard visualization tools.
DRIVE is useful in a wide variety of markets that require geospatial visualizations, including law enforcement, military command and control, military intelligence, consumer geoservices, traffic management, urban planning, business intelligence, and environmental studies. It can create visualizations for client-side/thick-client applications, as well as service-oriented Web 2.0 and/or mobile applications.